Measuring and analyzing key call center performance metrics (KPIs) is absolutely essential when evaluating the performance of your call center in the short and long term. At the same time, most call center managers are aware of the need to continuously monitor the KPIs of their department as an indication of customer satisfaction.
However, not everyone knows what are the major metrics you need to monitor and what are the industry standards for these metrics. To put it differently, This article contains a list of Top 15 Call Center KPIs & Metrics to Track In 2022, Including a list of KPIs that we believe that every call center manager needs to monitor these 15 KPIs, and that’s in order to improve the performance of his department and increase customer loyalty.
1. Service Level

This is a tool to measure the percentage of received calls in a certain time frame. By the same token, the standard service level assumes that operators will answer 80% of calls within 20 seconds. With this in mind, this is a common long-term goal for many call centers. Although this may be true, the Service level indicates whether a company has enough resources to connect all customers with operators and resolve their issues in a timely manner.
How to Improve & Fulfill Your SL?
You can improve your SL in a long term by simply:
-Implementing an IVR to cover all services and lower calls forwarded to agents.
-Using smart ACD techniques (Queues) based on agents’ skills and languages.
-Adding new channels for customer support such as Emails & WhatsApp.
-Extensive soft skills and product knowledge training.
-Distributing call center agents among different queues based on their skills and languages.
2. First Contact Resolution (FCR)

FCR is a basic call center KPI and it is quite challenging sometimes since it will be very easy to measure if your call center is having 1 communication channel while it will be more difficult to measure it when running an omnichannel call center that provides seamless customer experience across different channels, and that includes (voice, email, chat, SM, self-care websites and mobile applications) so it is better to measure it per channel.
It’s an important call center KPI that can help improve Customer Experience. It is important to realize that customers desire to have their queries solved during the first call. not to mention the first thing to remember when this happens they are more likely to be more loyal to the brand. Not to mention that FCR measurement lets you perform well to be able to meet the needs of your customers for the first time.
How to ensure that this KPI is met?
-Effective and smart ACD plans where calls are routed to the correct queues and agents are assigned as per their correct skillsets.
-Conducting continuous training sessions for your agents.
3. (QA) Quality Assurance Scoring
Quality Assurance measures the quality of conversations in order to ensure the proper level of customer satisfaction and employee performance, and it is consist of a set of criteria that must be met by the agent during the conversation over the phone. Not only that, but this may include how the agent greets the customer, the accuracy of the information he provides, how he solves the client’s problems, etc.
Agent performance is the key to measuring call quality, including how quickly they solve customer problems, how accurate they are at logging call information, and how efficiently they move from one call to another.
How to ensure that this KPI is met?
Make sure to have the right quality assurance tool in addition to having a dedicated quality assurance team who will be monitoring your team’s calls, working closely on their performance, and designing the coaching program accordingly.
4. Net Promoter Score (NPS)

Net Promoter Score (NPS) is a tool to measure a customer’s loyalty and customer experience. This is a new method of measuring customer satisfaction.
The NPS metric is a simple but very powerful tool to measure your customer’s satisfaction and their loyalty by asking one ultimate question:
“How likely are you to recommend company/brand/product X to a friend/colleague/relative?”
The answer to this question is on 11-point rating scale, ranging from 0 (not at all likely) to 10 (extremely likely).

How to ensure that this KPI is met?
- Reduce Response Time and AHT
- Identify and Reassign NPS Champions
- Listen to the Needs of Your Customers
- RethinkRemove NPS Killing- Tasks
- Always Ask for Feedback
- Try to focus on recognizing your Detractors.
- Make sure you are having a seamless customer journey map.
- Creating loyalty programs.
- Appreciate your promoters and set some special discounts/ gifts/ offers for them.
5. Customer Satisfaction Score (CSAT)

Like NPS, the CSAT is an excellent indicator of customer happiness. CSAT is a good measure to judge whether call center representatives are providing a low-quality or high-quality customer experience. However, keep in mind that the CSAT measures customer satisfaction with a product or service, whereas Net Promoter Score (NPS) measures customer loyalty to the company or organization.Often the customer is presented with a scale from 1 to 5 and based on an arbitrary scoring system, companies classify responses in multiple sentiments such as:
- Very unsatisfied
- Unsatisfied
- Neutral
- Satisfied
- Very satisfied
Like NPS, CSAT is a key indicator of customer loyalty and long-term. The major purpose of measuring CSAT scores is to identify the factors which are affecting the call center performance in a negative way and those which are affecting it in a positive way.
6. Customer Effort Score (CES)

Like NPS, the Customer Effort Score (CES) is a tool to measure customer satisfaction and an indicator of loyalty, which makes it a popular metric for measuring call center performance. You can measure CES by asking the customer one question (similar to NPS)
Customers rank their experience on a seven-point scale ranging from “Very Difficult” to “Very Easy.” Or some variation of it, from very difficult to very easy on a scale of 1 – 5.
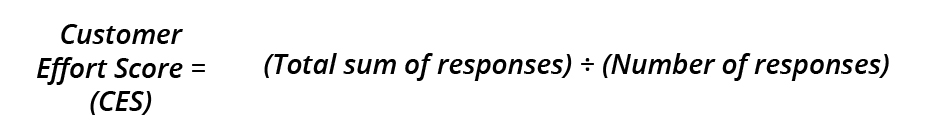
You can calculate it by finding the average of all responses, and this means taking the total sum of responses and dividing it by the total number of survey respondents.
7. Call Arrival Rate

The Call Arrival Rate is a call center metric that tracks the number of calls that come in per day throughout the past 30 days, allowing managers to identify any trends.
With this metric, call centers are able to assess the total number of calls a contact center agent receives within a specific time.
8. Percentage of Blocked Calls (Call Blockage)

When you measure this KPI percentage, you must determine whether it is a department-wide issue or an individual employee issue. Managers need to provide advanced training to employees struggling with call queues.
If this is a department-wide issue, you’ll want to upgrade the call center software, so you can handle larger numbers or calls. Investing in better call center software can improve the overall performance of your call center.
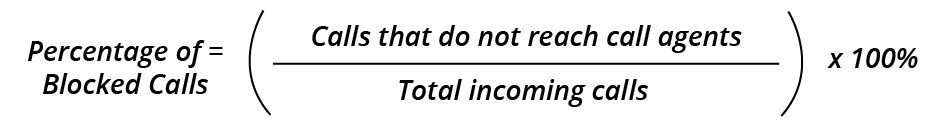
This KPI has a large impact on customer satisfaction. We can define it as the percentage of inbound callers that received the busy tone when they call and is often caused by one of the following:
- There are no available agents and no call queues configured (or the call queues are full) so callers hear a busy tone when they call or are routed directly to voicemail
- The call center software cannot adequately handle the call volume
Even one blocked call is considered as a missed opportunity to connect with a customer or prospect, this is a call center KPI is very important and call center managers should not ignore it.
9. Call Abandoned Rate (Abandonment Rate)

The Call Abandon Rate gives managers insight into the number of callers disconnected from the call before they interact with a call agent. Not to mention that this KPI is a tool to measure calls that were abandoned in the IVR and queue.

How to ensure that this KPI is met?
- Strategic workforce planning (have enough agents covering peak hours).
- Support forecasting and optimize call center agent scheduling.
- By using call-back technology.
- Improving In-Queue messages and avoiding long IVR options.
10. Average Handling Time (AHT)
")
The term Average Handle Time (AHT) is a call center KPI that is the average time that a customer service representative takes to complete a transaction. As a matter of fact, AHT typically includes the time and tasks that a customer follows the call or interaction until the agent starts the next call or chat. This KPI is a key measure for any call center planning system as it tells you how long a new call takes to be handled and not just the talk time.
The goal of many call centers is to reduce AHT, maximize efficiency, and increase the SL.
However, this can have a negative impact on service quality.

Here are some ways to lower AHT that will not influence service quality:
- Creating call center scripts and canned responses to save the agents time in answering FAQs by clients.
- Unifying all tools used by the agent into 1 screen instead of switching between screens increases the talk and/or hold time during the call.
- Recording all calls to find issues and learn from them during training sessions. Also, understanding the reason behind high or repeated hold and ACW times will provide better insights into managing the handling time and will help you design training programs accordingly.
11.Wrap Up Time/ After Call Work (ACW)
Wrap-up time or Average After Call Work Time is a great way to measure call center agent productivity. Average after-call work time measures the average time it takes agents to do the work associated with a call after it’s finished.
You need your agents to spend enough time to do this work accurately and thoroughly. However, if you find that the average After Call Work time is too high, there may be something else going on.

You can add the value of wrap-up time or the ACW to your call center platform. Thats based on your historical calculation of the average ACW and its impact on SL.
12. Average Speed of Answer (ASA)

With this critical metric, call centers can assess how long it takes for agents to answer a waiting call.
 When this metric is too high, it can mean that agents are taking too long on calls or taking too much time to pick up new calls.
13. Occupancy

Many professionals are mistakenly thinking that occupancy and utilization are the same while they are completely different metrics.
What is Occupancy?
Occupancy is a percentage that represents the amount of time that advisors spend on call-related activity while they are available and expected to be taking calls. Call-related activity includes talk time, hold time, and wrap-up time. It is very common that many people to refer to it as “productive time”.

It is typical for a call center’s occupancy to range between 80 and 85%. In this case, If your occupancy rate is at this level, then it is likely that your resource planning team is doing a good job! But, if the occupancy is consistently higher than 85%, then you are at risk of agent burnout.
14. Utilization

Like occupancy, utilization is a percentage. On the other hand, it differs from occupancy. Because utilization instead represents the amount of time that advisors spend logged in while being present in the call center.

This metric represents the percentage of time that call center agents spend on handling calls & customer interactions and call-related work all together.
15. First Response Time (FRT)

Ensuring that call center representatives are handling requests quickly leaves a lasting impression on callers on the long term. You can calculate this KPI on an hourly basis, several days per week, and a yearly basis.

According to multiple studies, approximately 45% of callers will leave a call within the first minute of waiting. Not to mention, after three minutes of waiting, an astonishing percentage of 70% of callers will leave the call.
How to reduce the first response time?
-Adopting Omnichannel: To reduce FRT, the call center can start providing customer support across multiple channels including. This includes WhatsApp, social media, email, chat, and SMS.
Proper Staff Coaching: Training can ensure an agent on the job isn’t clueless. In addition, to keep the team up to date on the processes needed to be followed during the call and after it. This saves time and results in reducing FRT.


